Reduce the time to conduct a root-cause analysis on virtual machine issues related to VMware vSAN
I helped design a highly visual tool that reduces the time a Virtual Infrastructure administrator takes to troubleshoot a problematic virtual machine and find the root cause. The same tool is also very valuable for inexperienced users as it clearly shows how the vSAN platform works.
• Duration: 3 months
• My role: Product Designer
• My responsibilities: user research, prototyping, aligning PM and engineering, UI design
• Platform: Enterprise web application
Now the capacity of all disks across all servers will be combined to form one big pool of capacity: the vSAN datastore.
Each virtual machine deployed on the cluster will now have access to the entire datastore. And can benefit from redundancy, encryption and data protection features.
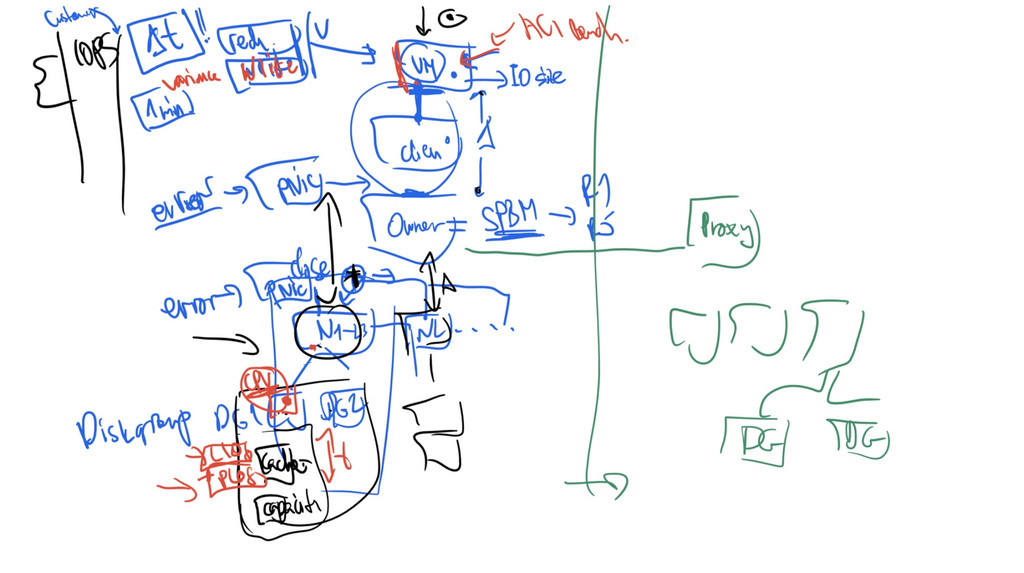
I wanted to make sure I asked the right questions and got the right answers.
1. What are the users' current flows to fix issues that this feature addresses?
2. Would the participants understand the topological graph?
3. Would the latency information we provided satisfy their needs and what other data do they need?
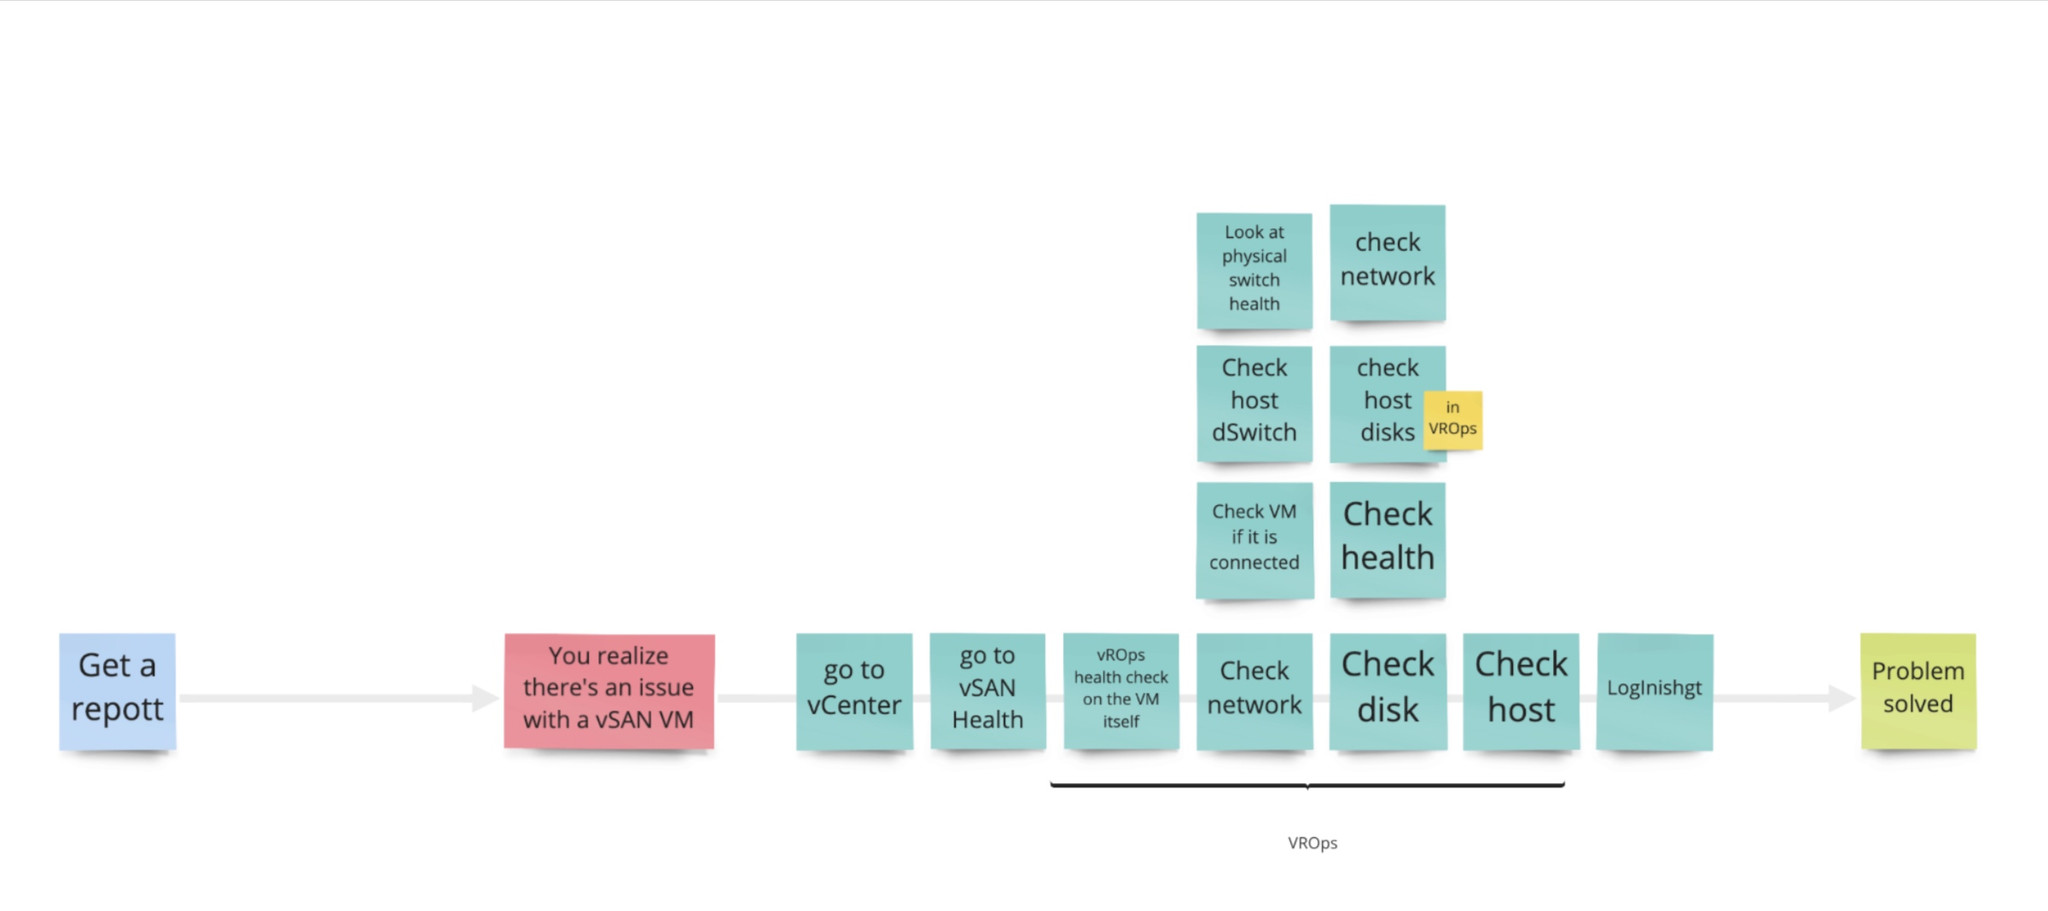
After we had a basic prototype, I conducted both 1:1 and group research sessions with users. One exercise that I had prepared for the participants was to map their 'as-is' end-to-end flow of VM troubleshooting. and engineers.
We did whiteboard/brainstorming sessions to figure out the scope and the exact functionality we wanted to ship
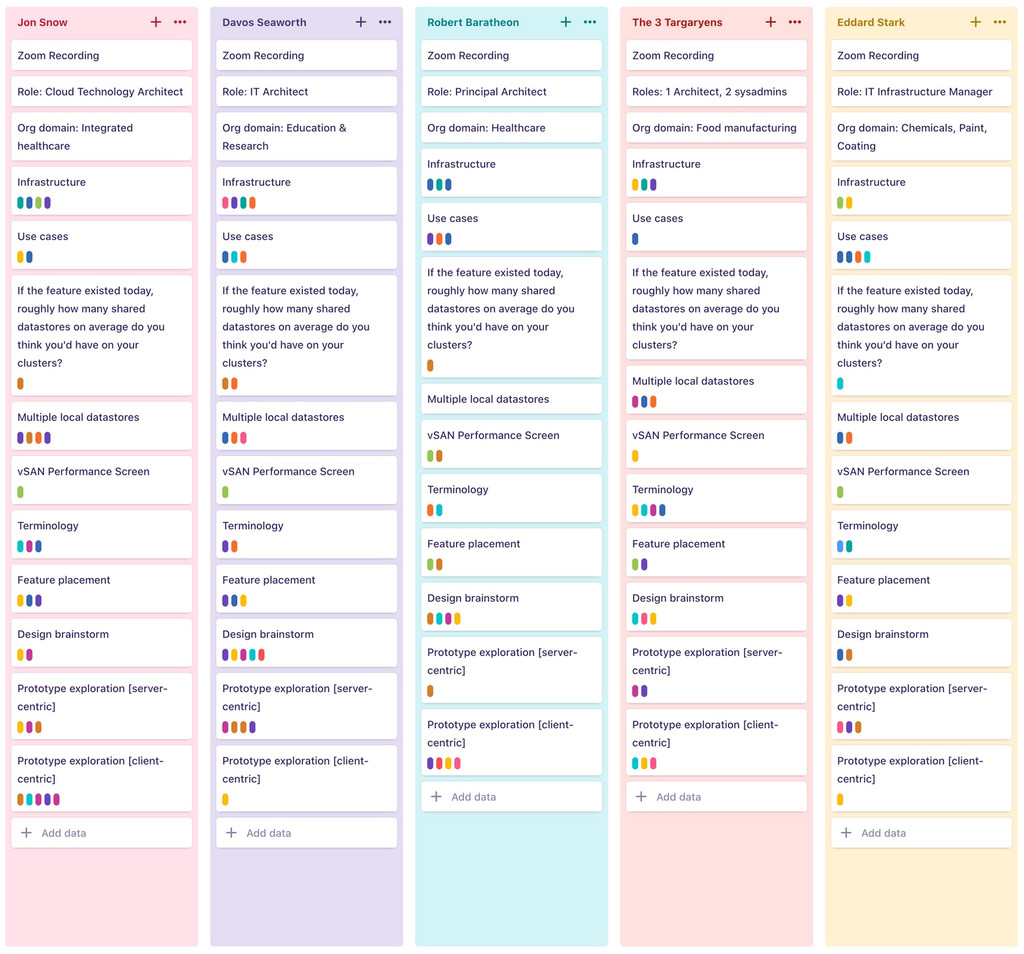
Each card is clickable and contains all user quotes and notes that I gathered.
The research
synthesis
The colour-coded tags allow for a quick at-a-glance view of common patterns of user behaviour and other similarities.
I started all user interviews with general questions about the person's company, position, responsibilities, the infrastructure they work with.
That way I have a good understanding of their context before I proceed to my project-related questions.
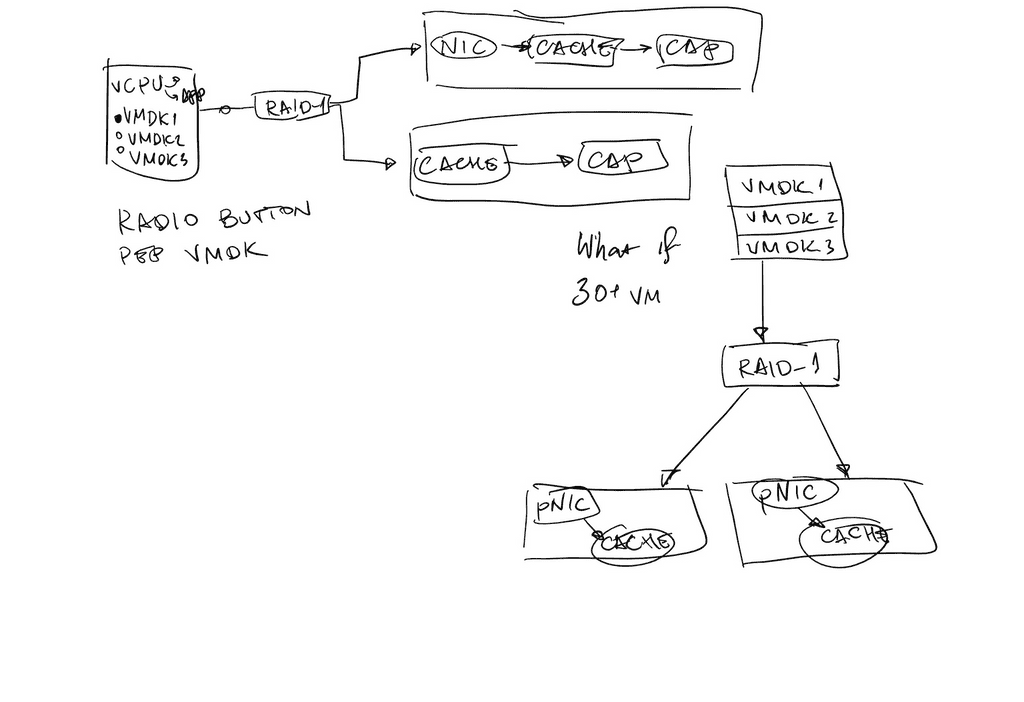
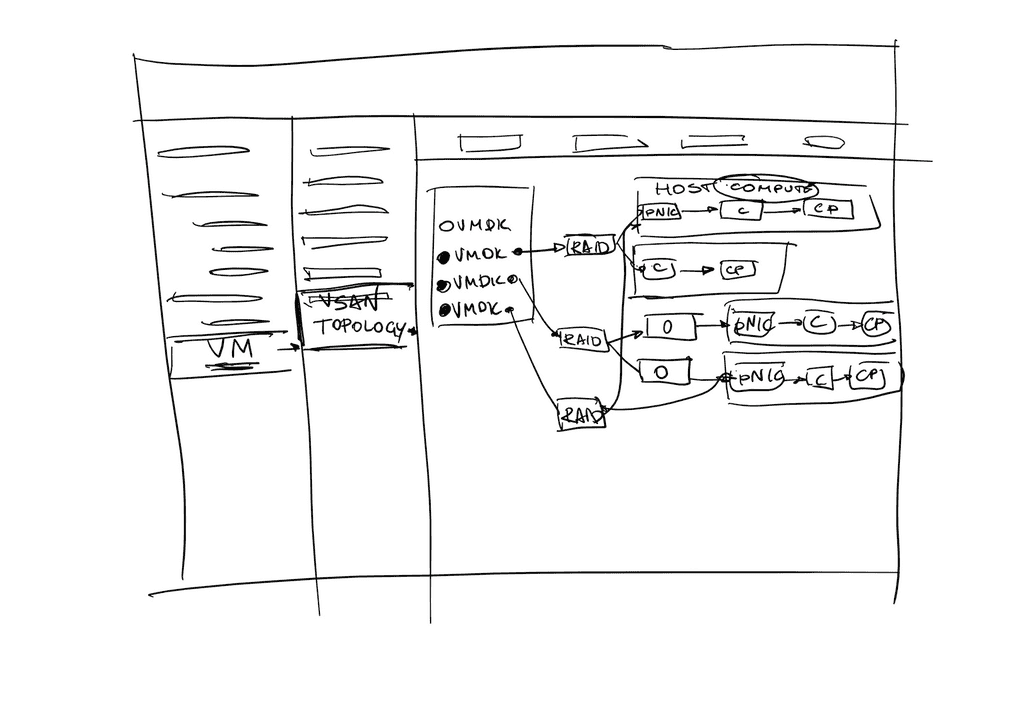
The topology design had two purposes:
1. Show the physical placement of the virtual machine objects and components (the parts it is made of) distributed across the cluster servers
2. Show the latency between each layer of the vSAN stack (physical and virtual network adapters, cache, and capacity disks).
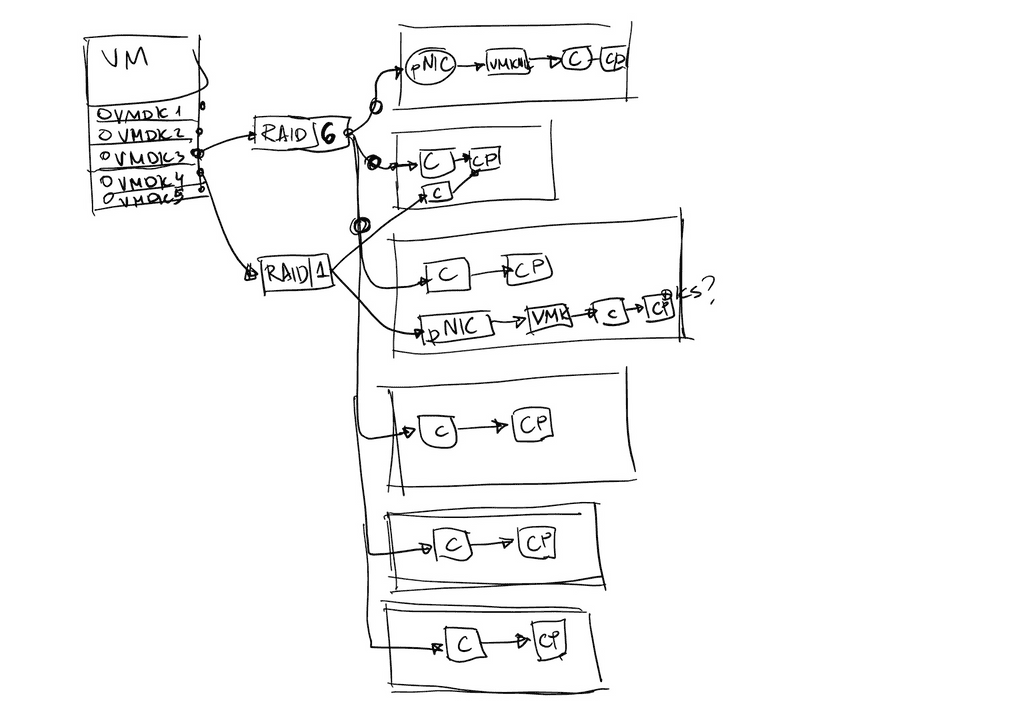
The GUI design: scalability problems
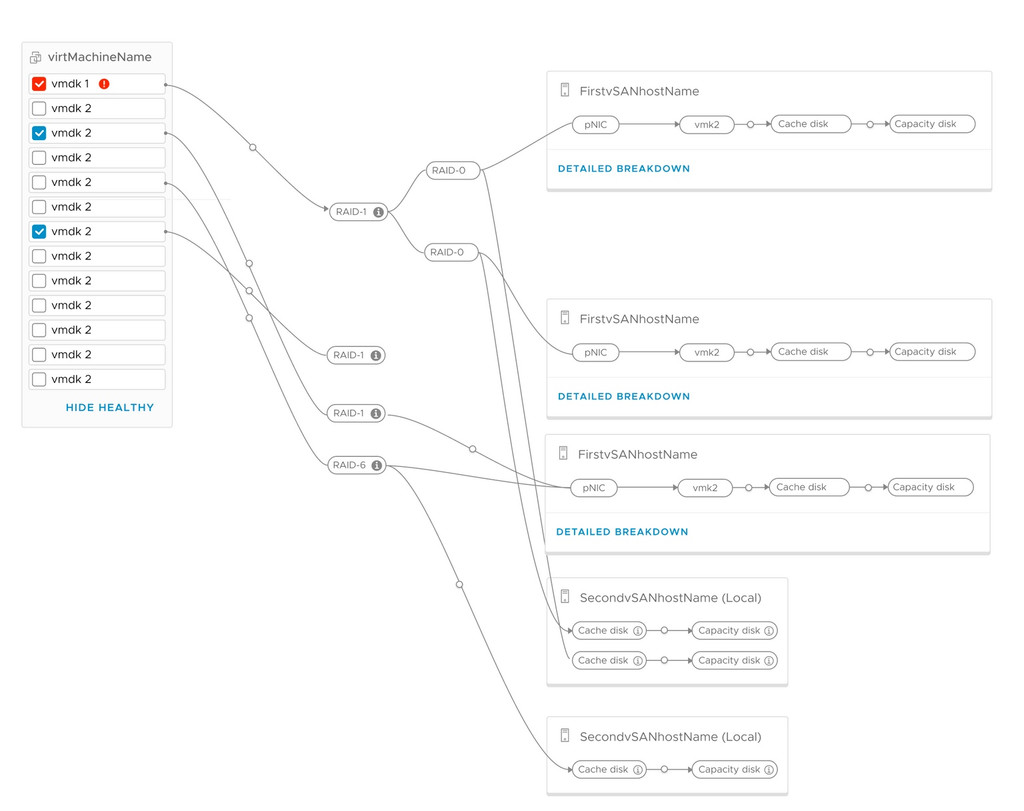
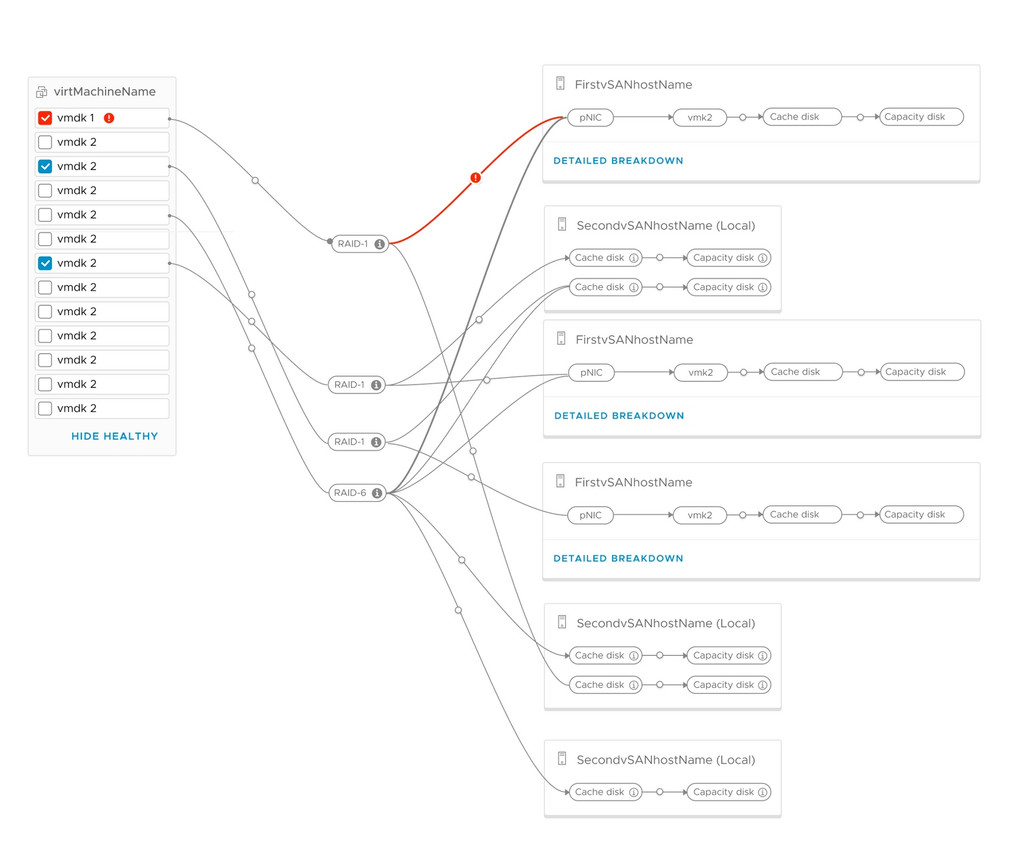
The problem with the topological visualisation is that it does not scale well when the user wants to have a look at multiple virtual machine objects at a time. Depending on certain settings the diagram can become extremely convoluted and unreadable.
One option to fix this was to 'minimise' the host cards without issues and only emphasise the problematic aspects. That wasn't possible for MVP however, as not every latency value has a pre-defined threshold that would trigger it to turn red.
I raised the issue of accessibility to the vSAN front-end team a little bit prior to the implementation process. Such a visual design could be impossible or very difficult to use by people with impaired or no vision.
Therefore I connected the vSAN front-end team with a special accessibility experts team at VMware. They advised to use an SVG-based graph library and not the one originally considered (HTML Canvas-based). The accessibility team also consulted on how to make all this screenreader-friendly.
Interactive walkthrough